EMI III Heating Microscope Software
The EMI III software is the core of the EM301 heating microscope, automating its operation and providing access to all essential measurement-related functions. EMI III can be integrated into existing heating microscopes from Hesse Instruments or Leitz as an upgrade.
Main features
Overview and intended use
The EMI III heating microscope software is based on Hesse Instruments’ tried-and-tested EMI 2 image analysis software and has formed an integral part of our heating microscopes since 2015. The software aims to simplify operations involving the heating microscope and to make them safer, as well as improving the quality of the measurement results.
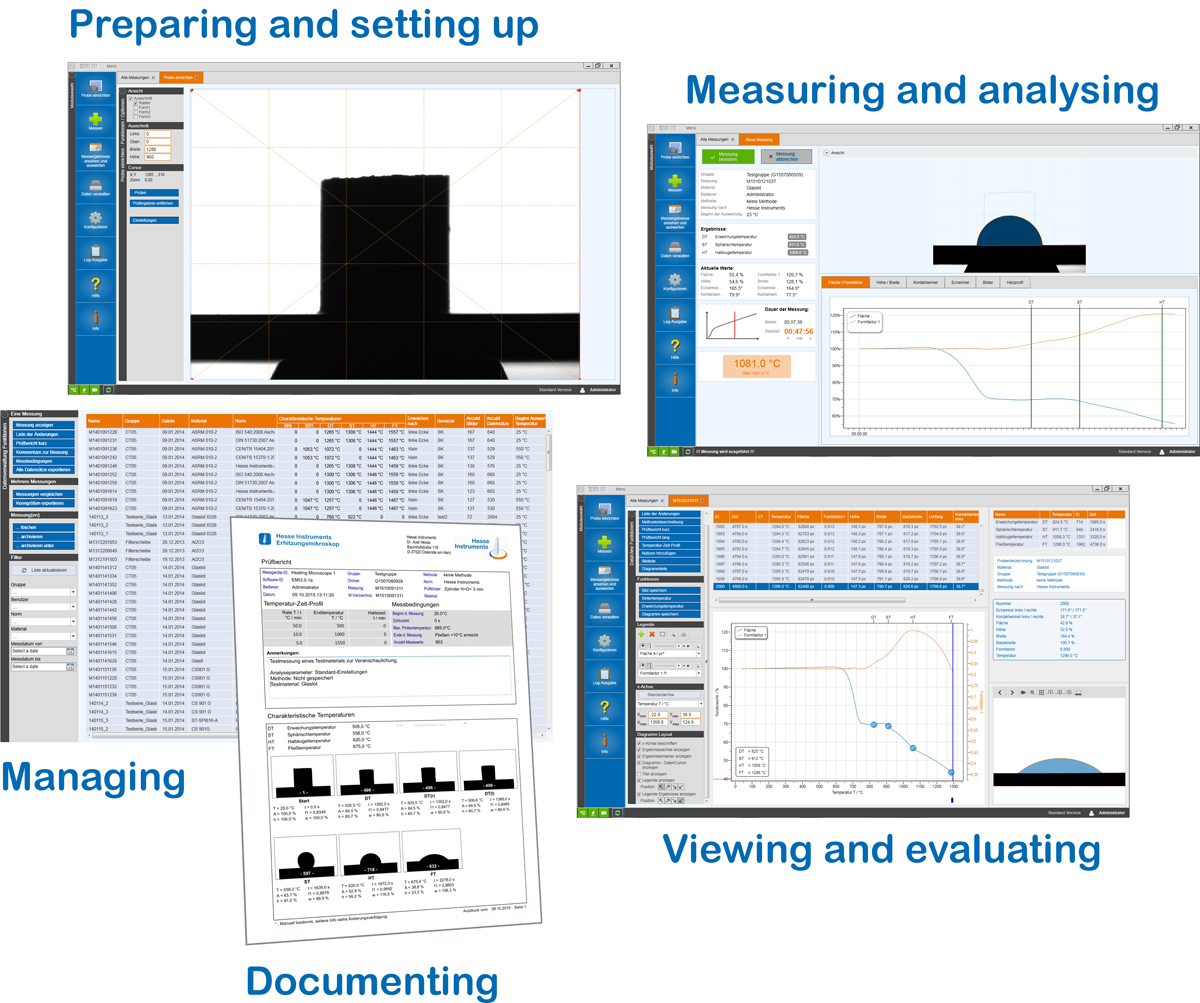
As the central control panel of the heating microscope, EMI III is responsible for control, operation and management. Almost all steps before and during measurement, right through to evaluation and documentation, are performed via the software. The operator can therefore access all information and execute all functions within a combined environment.
Evaluation, display and analyses
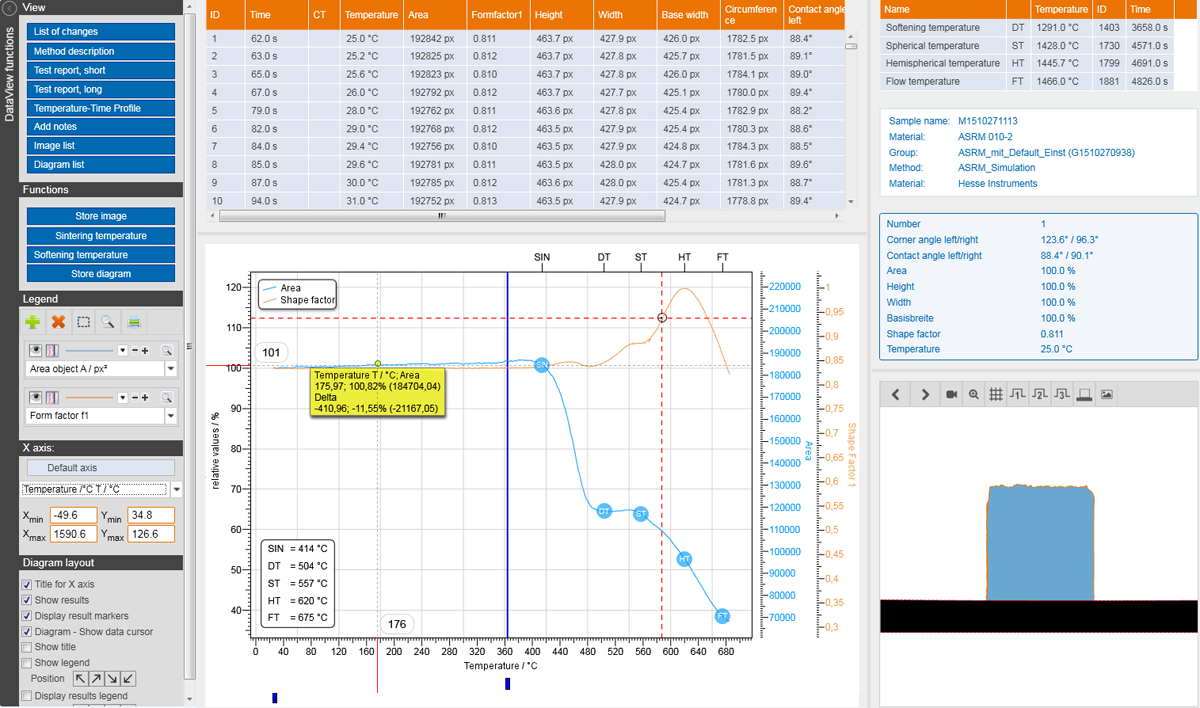
Measurements are evaluated automatically by greyscale analysis of the recorded silhouettes, and newly developed evaluation algorithms allow the system to evaluate samples with a wide range of material characteristics. Analysis is supported by the use of modern hardware and can therefore deliver precise and accurate results.
The obtained results are displayed as images, graphs, tables and videos in an interactive manner in order to simplify their viewing and evaluation: for example, if you select a measured value in a graph, the table view automatically displays the corresponding image and numerical values from the corresponding dataset.
EMI III allows quantitative evaluation of materials’ sintering, softening, melting and wetting characteristics using, among other things, the characteristic temperatures from various standards relating to the analysis of melting characteristics of ashes. In addition, the software automatically calculates various geometric parameters for the specimen, such as the height, width, area, corner angle, and contact angle, or a measure of the specimen’s roundness.
Range of functions in detail
Aside from specimen preparation and manual operation of the heating microscope, EMI III provides the full range of functions for the instrument’s operation:
Control and display
- Input and management of heating programmes
- Relaying of heating programmes to furnace control unit
- Indication of heating microscope’s communication status
- Real-time display of measurement results
Measurement and evaluation
- Measurement preparation: adjustment of camera image and input of measuring parameters
- Automatic measurement (according to standard)
- Automatic data collection
- Automatic evaluation in real time
- Automatic termination of measurements according to defined end criteria
- Automatic determination of characteristic temperatures in accordance with standards
- Assistance with manual evaluation once measurement is complete
Documentation and display
- Interactive display media (table, graph, images, video)
- Automatic generation of test reports
- Automatic generation of custom reports according to user specifications
Management
- Measurements in the measurement database
- Methods for storage of measuring parameters
- Users and rights
- Function for archiving measurements
Benefits at a glance
- Performance
- Efficiency
- Control and flexibility
State-of-the-art hardware and software |
|
Advanced evaluation algorithms |
|
Network-compatible CCD camera |
|
Clear, structured user interface |
|
Methodological management |
|
Automatic evaluation and documentation |
|
Interactive display of measurement results |
|
Configuration of evaluation parameters |
|
Traceability of changes in measurement evaluation |
|